BlogNOCO Real Estate October 12, 2021

No Inventory?


One misconception about today’s market is that there is ‘no inventory.’

Actually, there are numerous new listings that hit the market each month. It just so happens that they tend to sell quickly.

The numbers show the number of new listings that came on the market in September closely equate to the number of sales that occurred.

  •  In Larimer County, 693 new residential listings hit the market last month and there were 688 sales.
  •  In Weld County, there were 681 new listings and 733 sales.
  •  In Metro Denver, there were 6125 new listings and 5233 sales.

So, while homes tend to sell quickly today, there is still a significant amount of new inventory hitting the market each month for buyers to consider.

BlogKeenesburg Real EstateVirtual Tour October 8, 2021

Your Next Investment Opportunity Awaits!

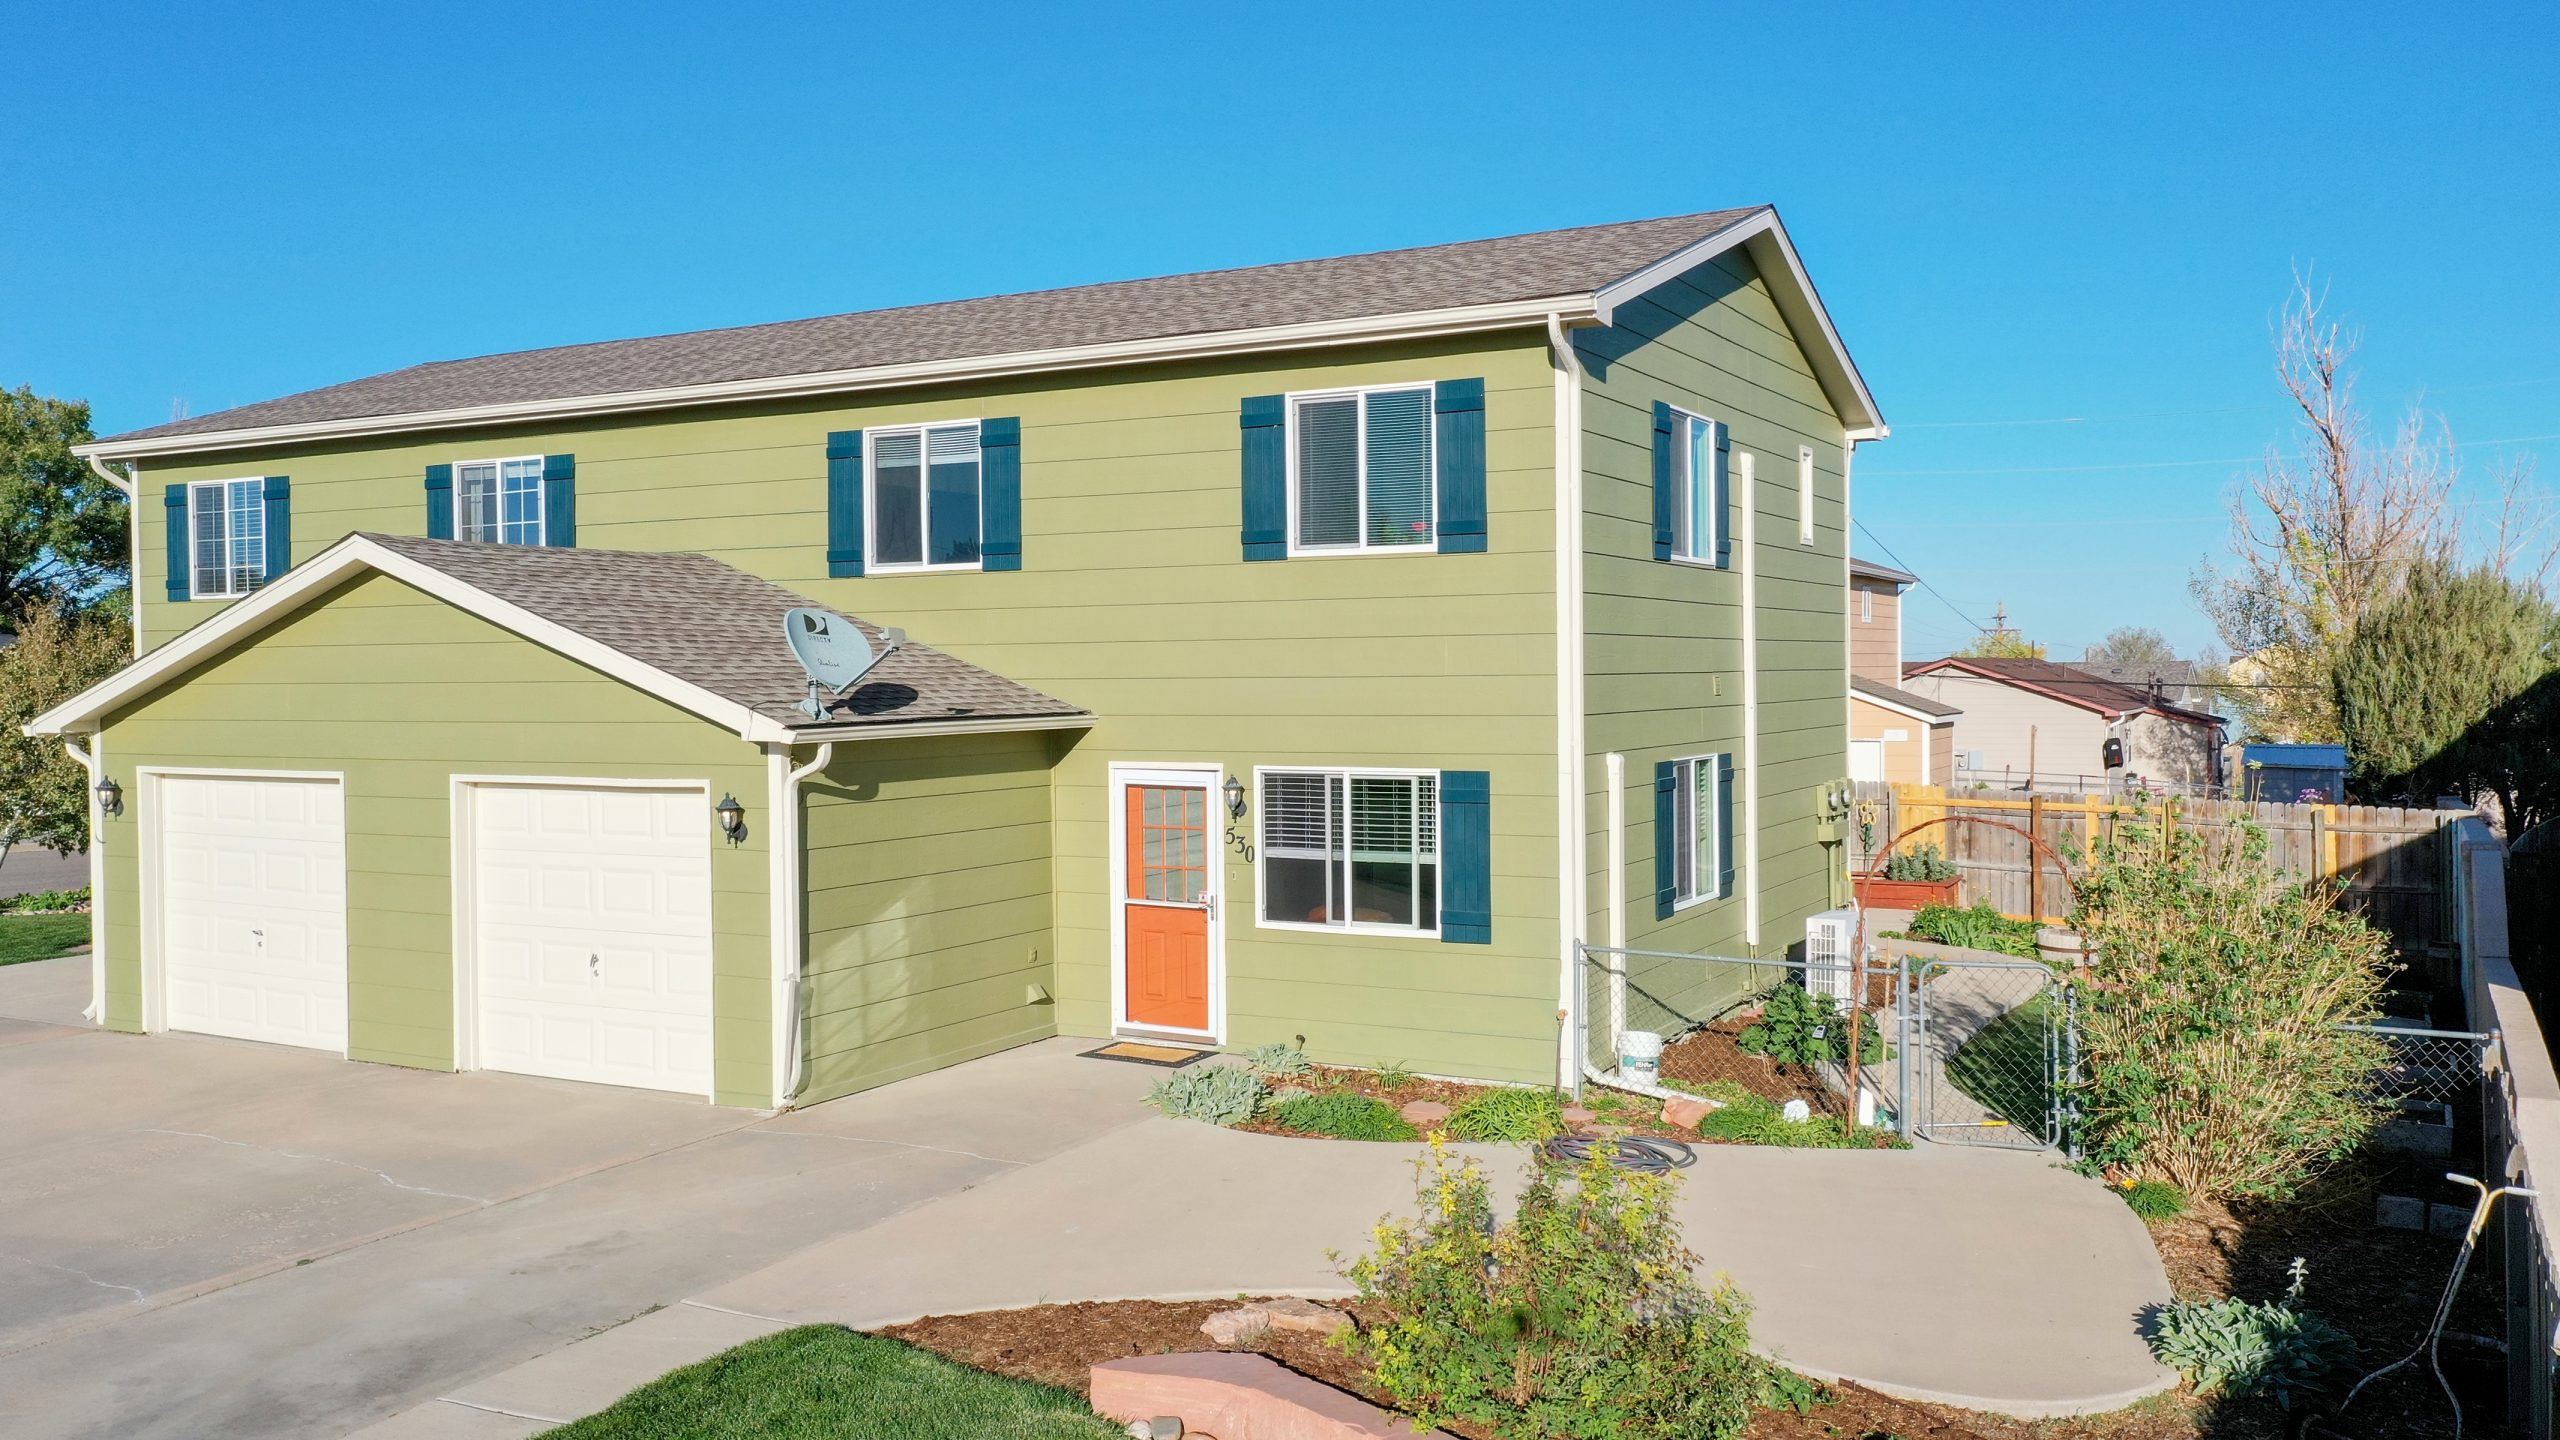
520 S. Pine Street & 530 S. Pine Street offer a GREAT INVESTMENT OPPORTUNITY! This a fantastic duplex in quickly growing Keenesburg is a rare find. Unit 530 has 4 bedrooms and 2 baths, and has been updated with new flooring, new cabinetry and Karastan SmartStrand carpet. It also has a great back patio with pergola overlooking mature landscaping. Unit 520 is largely the same layout, but has 2 bedrooms and 2 baths and is in great condition, but fewer updates. Both units have fenced yards, attached garages, and additional parking space. The entire building has new exterior paint, new roof in 2019, and new water heaters in 2020. A fantastic property and amazing opportunity! NO HOA! Call (970) 534-5440 to schedule your private tour or click here for more information. 


BlogHousing MarketNOCO Real Estate September 29, 2021

Monday with Matthew


Hello there!  I’m Windermere Real Estate’s Chief Economist, Matthew Gardner, and welcome to the latest episode of Mondays with Matthew.

Today we are going to take a look at the latest Home Purchase Sentiment Index survey that was just put out by Fannie Mae. And for those of you who may not be familiar with this survey, it’s actually pretty important and one that I track closely as it’s the only national, monthly, survey of consumers that’s focused primarily on housing.

The survey shows the responses of 1,000 consumers across the country to roughly 100 survey questions on a wide range of housing-related topics. Now, don’t worry, we aren’t going to look at all 100 questions – just the ones that solicit consumers’ evaluations of housing market conditions and that also address topics related to their home purchase decisions.
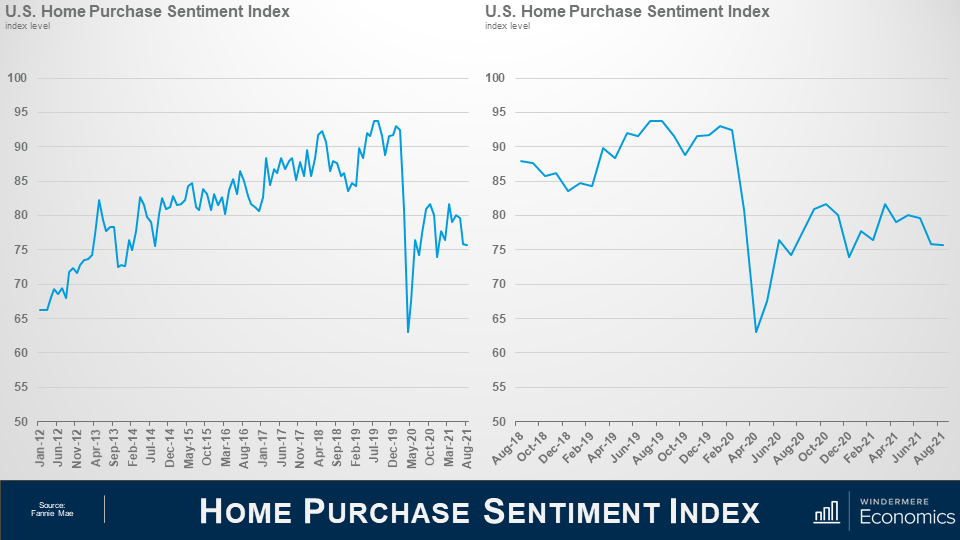
Two line graphs side by side on a presentation slide titled “Home Purchase Sentiment”. On the Left is a graph showing the U.S. Home Purchase Sentiment Index Index Level from January 2021 to August 2021. From January 2021 to July 2019, there’s a slow increase from just above 65 to a peak just under 95. In May 2020 however, there’s a sharp valley that dips between 60 and 65. On the right shows the last three years where the Pandemic induced drop is more clear. The drop in sentiment index lasted roughly from February 2020 to August 2020, and has held relatively stable ever since, sitting between 75 and 83.

So, as you can see here, the overall index was trending higher pretty consistently until the pandemic happened which had massive, but temporary, impacts. And looking the last 3-years, you can get a better idea as to the speed of the pandemic induced drop – pretty remarkable.

Now, you will also see that the index recovered quite quickly; however, it fell again last fall as the pandemic was not going away at the speed many had hoped for – it rose again this spring but has been pulling back for the past few months but, that said, the August index level essentially matched the level seen in July.

Now let’s look at the questions that are used to create of the index number and how consumers responded.
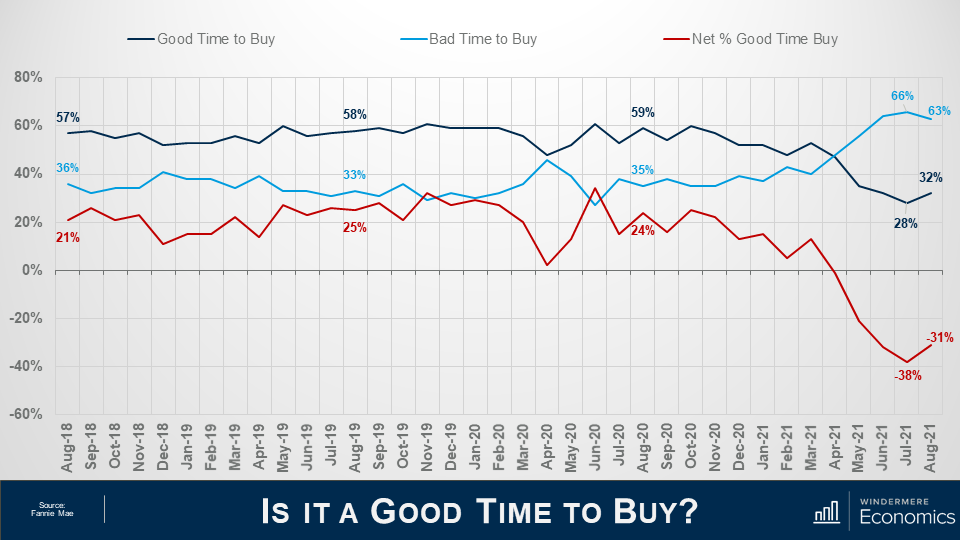
 

Three lines on the same graph on a slide titled “Is it a Good Time to Buy?” which shows sentiment compared to those who think it’s a good time to buy and those who think it’s a bad time to buy. The graph’s x axis shows the percentage of respondents and the y axis shows dates from August 2018 to August 2021. The navy line indicates “Good Time to Buy” the light blue indicates bad time to buy, and the red indicates the net percentage good time to buy. The navy line sits above the other two lines for the most part, but it dips below and switches places with the light blue line in April 2021. The net share of those who say it’s a good time to buy jumped 7%, which is the first time it’s improved in the last four months.

When asked whether it was a good time to buy a home, the percentage who agreed with that statement rose from 28 to 32%, while the share who thought that it is a bad time to buy dropped from 66 to 63%. And, as a result, the net share of those who say it is a good time to buy jumped 7 points month over month and its notable that this is the first time the net share number has improved in the past 4-months.

What I see here is that – although improving modestly, the general consensus is that it is not a good time to buy and that sentiment is being driven by two things: One – there are still not enough homes on the market, and two, rapidly rising prices are scaring some people.
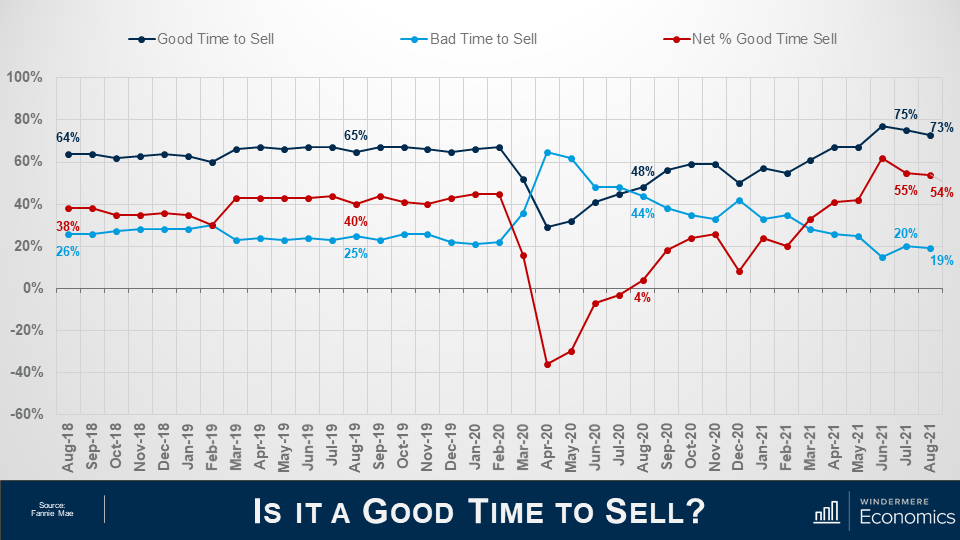
 

Three lines on the same graph which shows seller sentiment. The presentation slide I titled “Is it a Good Time to Sell? The graph’s x-axis shows percentages from -60% to 100% and the y-axis shows thedates from August 2018 to August 2021. The navy line represents those who think it’s a good time to sell, the light blue line indicated those who think it’s a bad time to sell,and the red line indicates the net percentage of people who think it’s a good time to sell. The navy line is mostly on the higher end, sitting in the 65% range, until March 2020 when it flips with the light blue line. They switch back in August 2020 when they are 48% and 44%. The different grows in the last few months, landing at 54% net difference in August 21.

And when asked if they thought it was a good time to sell their homes it was interesting to see that share drop from 75 to 73% while the percentage who said that it’s a bad time to sell dropped 1 point to 19% and as a result, the net share of those who said it was a good time to sell pulled back by 1% but it still indicates that more owners think that it is a good time to sell than don’t.
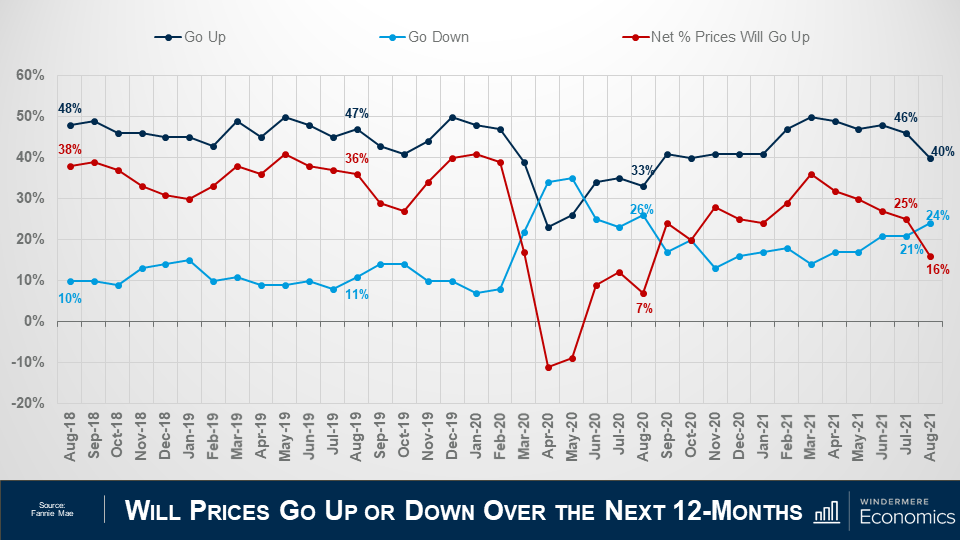
 

Three lines on the ame grah to compare different sentiments about whether home prices will go up in the next 12 months. The slide is titled “Will Prices Go Up or Down Over the Next 12-Months” and the x-axis shows the percentage of respondents from -20% to 60%, and the y-axis shows the dates from August 2018 to August 2021. The navy lineindicates the respondents who thinkprices will go up, the light blue line shows the respondents who think prices will go down, and the red line shows the net percentage difference. In August 2021 net share of Americans who say home prices will go up dropped by 9 points – from 25%, down to 16%.

Looking now at the direction of home prices over the next 12-months, the percentage who think that home prices will rise fell from 46 to 40%, while the percentage who expected home prices to drop rose from 21 to 24%.

As a result, the net share of Americans who say home prices will go up dropped by 9 points – from 25%, down to 16%.

Although this may sound concerning, I should add that the share of respondents who thought that home prices will remain static over the next year rose from 27% to 31%.
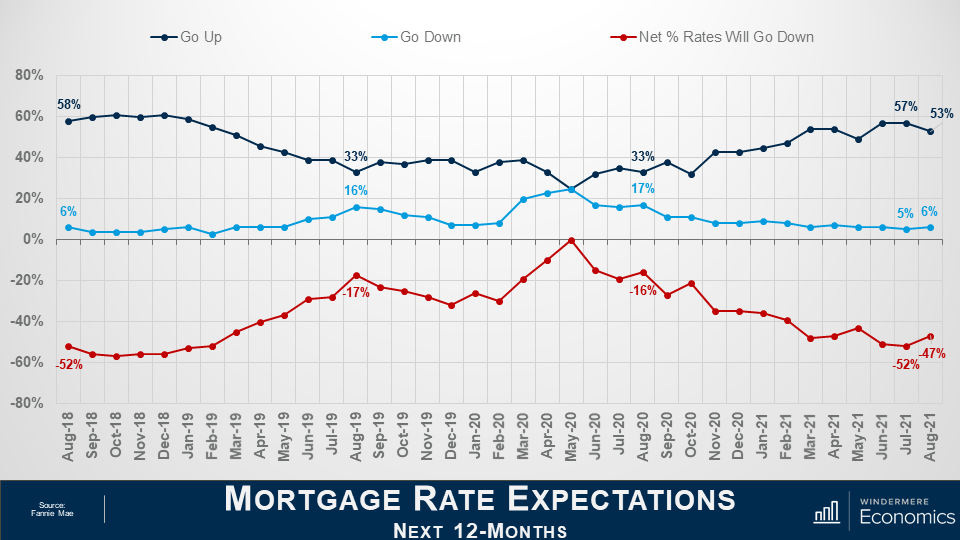
 

Three lines on the same graph comparing the different expectations of people considering the mortgages rates of the next 12 months. The slide is titled “Mortgage Rate Expectations for the Next 12-Months” and the graph’s x-axis goes from -80% to 80% and the y axis shows dates from August 2018 to August 2021. The navy line indicates respondents who think mortgage rates will go up, the medium blue line shows those who think mortgage rates will go down, and the red lines shows the net percentage rates will go down. Most people think rates will go up. The net share of Americans who believed that mortgage rates will go down over the next 12 months rose by 5%

On the financing side, the share who think mortgage rates will rise over the next 12 months dropped from 57 to 53%, while the percentage who believed rates would be lower rose from 5% to 6% and, as a result, the net share of Americans who believed that mortgage rates will go down over the next 12 months rose by 5%, and with 35% of respondents thinking that that rates will hold steady – it’s clear to me that a vast majority are not worried about mortgage rates rising.

The takeaways for me so far are that consumers tempered both their recent pessimism about homebuying conditions and their upward expectations of home price growth.

Most notably, a greater share of consumers believe that it’s a good time to buy a home – though that population remains firmly in the minority at only 32% – while the ongoing plurality of respondents who expect home prices to go up over the next 12 months dropped but was still well above the 24% of consumers who believe home prices will fall.

Now, there are two more questions that are worth looking at which aren’t directly related to home buyers and sellers but are still important as they look at employment and incomes.
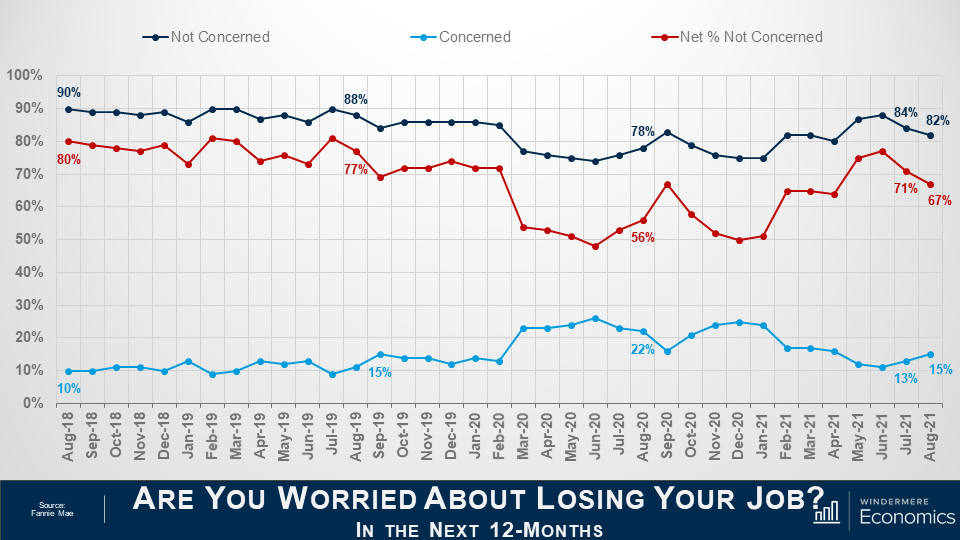
 

Titled “Are you worries about losing your job in the next 12 months” three lines on the same grph show the comparison of respondents between Augut 2018 and August 2021. The navy line represents the respondents who are not concerned, the light blueline shows those who are concerned, and the red line shows the net percentage not concerned. The net share of Americans who say they are not concerned about losing their job fell by 4 percentage points month over month, but remains well above the level seen a year ago.
The percentage of respondents who said that they are not concerned about losing their job in the next 12 months remains very high at 82%, but it did drop by 2 points month-over-month, while the percentage who said that they are concerned ticked up to 15% from 13%. As a result, the net share of Americans who say they are not concerned about losing their job fell by 4 percentage points month over month, but remains well above the level seen a year ago.


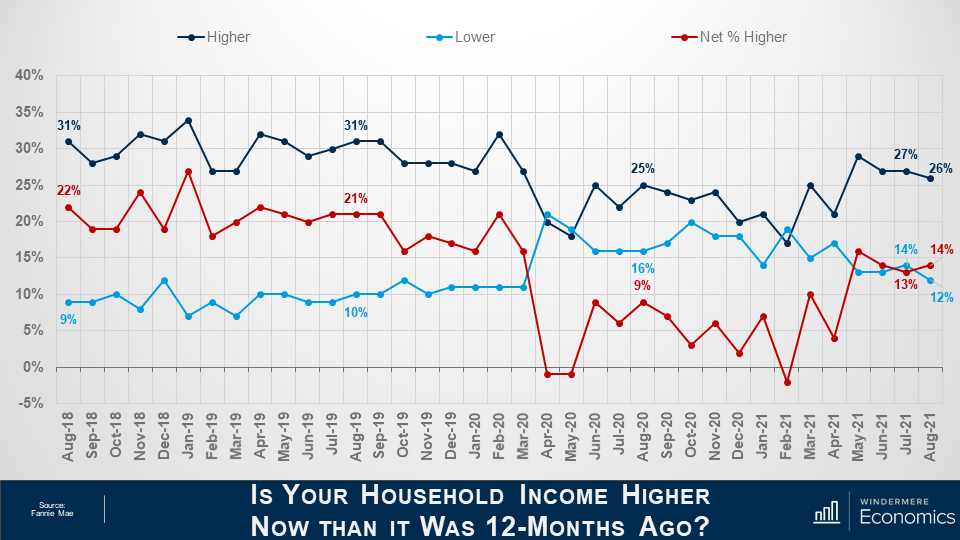
This slide is titled “Is your household income higher now than it was 12-months ago?” the graph has 3 lines on it comparing different responses from the survey. The x-axis goes from -5% to 40% and the y-axis shows the dates from August 2018 to August 2021. The navy line indicates respondents who reported a higher income, the light blue indicates those with lower income and the red line shoes the net percentage who have higher income. The navy line is mostly the largest portion staying on the top of the graph, but it dips below the light blue line in April 2020, May 2020, and February 2021. The red line say a 1% increase in the last month, but rose from 9% in August 2020 to 14% in August 2021.

And finally, when households were asked about their own personal finances, the percentage of respondents who said that their household income is significantly higher now than it was 12 months ago pulled back one point to 26%, while the percentage who said that their household income is significantly lower dropped to 12%.

As a result, the net share of those who said that their household income is significantly higher than it was a year ago rose by 1 percent month over month and came in 5 points higher than a year ago. It’s also worthwhile noting that most said that their household income is about the same as it was a year ago with that share rising from 56 all the way up to 59%.

Looking at all the numbers in aggregate, the index level was relatively flat in August with three of the index’s six components rising month over month, while the other three fell, and that tells me that the continued strength of demand for housing and definitely favorable conditions for home sellers may well be offsetting broader concerns about the Delta variant of COVID-19 as well as rising inflation that have both negatively impacted other consumer confidence indices.

Most consumers continued to report that it’s a good time to sell a home – but a bad time to buy – and they most frequently cite high home prices and a lack of supply as their primary rationale.

However, the ‘good time to buy’ component, while still near a survey low, did tick up for the first time since March, perhaps owing in part to the very favorable mortgage rate environment as well as growing expectations that home price appreciation will begin to moderate over the next year. A sentiment that I personally agree with.

Well, I hope that you have found this month’s discussion to be interesting. As always if you have any questions or comments about this topic, please do reach out to me but, in the meantime, stay safe out there and I look forward the visiting with you all again, next month.


Bye now!

NOCO Real Estate September 9, 2021

Buying and Selling a Home at the Same Time


Successfully selling a home and buying a home are significant accomplishments on their own, but when their timelines cross it can be difficult to manage both. If you’re thinking about doing both simultaneously, it’s equally important to understand the steps you can take to make the process go smoothly as it is to have a backup plan in case it doesn’t. Above all, the balancing act required to pull off both deals highlights the importance of working closely with a trusted and experienced real estate agent.

Do I buy or sell first?

One can imagine a perfect world in which the two transactions go through one right after the other. However, this is not usually the case. So, should you list your current home first or start by putting in offers on a new one? There are pros and cons to both.

Selling your current home first allows you to make offers on a new home with cash in your pocket, increases your buying power, and avoids having to juggle two mortgages simultaneously. On the other hand, it creates a gap of residence, often leaving homeowners wondering where they’ll stay until they move into their new home or whether they may need to rent before they can buy again. Sellers may also negotiate a rent-back agreement with the buyers, allowing them to rent the house from the new owners before they move in.

Buying before selling solves the need for any temporary housing and makes the overall moving process much easier. Having a residence established ahead of time means you’ll only have to move once, which can save you some serious stress during this time of transition. Oppositely, buying a new home before you sell your current one will put an added strain on your finances. Having two concurrent mortgages equates to taking on more debt, which could result in less-than-favorable loan terms for purchasing your new home. Without the lump sum generated by a home sale in your pocket, coming up with enough money for a down payment may be a challenge and obtaining private mortgage insurance (PMI) may be in the cards. Finally, buying before selling comes with an obvious assumption—that your current house will sell.

Ultimately, the order of operations depends on your situation. Perhaps you’re moving due to a change of employment, and you need to direct all your energy toward buying a new home by a certain date before you can even think about selling your current one. No matter which route you take, it’s important to communicate your timeline to your listing agent or your buyer’s agent so they can strategize accordingly.

Buying and Selling a Home at the Same Time 

Local Market Conditions

Buying and selling at the same time will come with a certain duality: at each step in the process, you’ll have to balance your responsibilities as both a buyer and a seller. For example, when assessing your local market conditions, you’ll be looking at not one, but two housing markets.

  • Seller’s Market: Selling in a seller’s market means that that you’ll need to be prepared to move once you list, since you could be looking at a short selling timeline. However, relying too heavily on the assumption that your house will sell quickly could make things dicey down the road. If you’re buying in a seller’s market, finding a new home may take longer than expected. You could potentially be waiting weeks or months for an offer to get accepted.
  • Buyer’s Market: Selling in a buyer’s market typically means that homes stay on the market longer. If you proceed with a new home purchase just after you’ve listed your current house, know that it may take a while to sell. If you’re buying in a buyer’s market you can afford to be picky, knowing that time is on your side. With fewer people buying homes, sellers will be more flexible, giving you leverage to negotiate your contingencies.

Having a Backup Plan

If only you could wave a magic wand and make both transactions go through as planned. That’s why it’s important to have a backup plan in place to right the ship should things go sideways at any point in the buying or selling process. Talk to your agent about which options may be right for you. Here are a few:

  • Sales Contingency: Buying your new home with a sales contingency allows you to opt out of the purchase contract if your home doesn’t sell by a specified date. Purchasing contingent on the sale is rare in highly competitive markets.
  • Bridge Loan: If your current home hasn’t sold yet and you’re not able to afford the down payment on a new home, a bridge loan may be a fitting solution. Bridge loans can be used to cover the down payment on a new house and are repaid once your existing home has sold.
  • Rent-Back Agreement: A rent-back agreement is a clause in the sales contract that allows the seller to rent their old home from the buyer for an agreed-upon period of time before the buyer moves in. This can be especially helpful in situations when the seller is having trouble finding a new home.

For more information on buying and selling a home at the same time, give me a call at (970) 534-5440.

Fort Collins Real Estate September 3, 2021

Construction Jobs

When you see people working to build a new home or new commercial building, you may wonder how much money they earn.

Here is some interesting research from the Bureau of Labor Statistics which ranks the highest-paying construction jobs based on median annual income.

Who knew that elevator and escalator installers would be at the top?

  1. Elevator and Escalator Installer = $88,540
  2. Boilermaker = $65,360
  3. Building Inspector = $62,860
  4. Electrician = $56,900
  5. Plumber = $56,330
  6. Ironworker = $53,210
  7. Sheetmetal Worker = $51,370
  8. Carpenter = $49,520
  9. Equipment Operator = $49,100
BlogLoveland Real EstateVirtual Tour August 23, 2021

Lake Life Meets Luxury

Welcome to exquisite Northern Colorado lake living! 914 Oleander Drive, Loveland is situated on two large waterfront lots and gives you access to everything the city offers and the serenity and privacy of exclusive lake living. Nearly 170 feet of private shoreline on just under 1/2 acre provides the perfect space for relaxation or recreation as well as gorgeous views of the foothills and front range. This centrally-located property is completely fenced and gated and features an open floor plan and large windows, allowing for plenty of natural light and views from nearly every room. The large kitchen and French doors lead to a raised deck and patio areas that give you limitless options for entertaining. Enjoy sunsets over Silver Lake from the private master bedroom balcony. Store your toys in the detached heated 1100+ sq ft. shop. Loaded with new a hot water boiler, newer roof, double pane windows, and four mini-split air conditioning units on a mature lot, you’ll be kept in comfort all year round. Call (970) 534-5440 to schedule your private tour or click here for more information. 


BlogFort Collins Real EstateNOCO Real Estate August 4, 2021

Colorado Gardner Report


The following analysis of the Metro Denver & Northern Colorado real estate market is provided by Windermere Real Estate Chief Economist Matthew Gardner. We hope that this information may assist you with making better-informed real estate decisions. For further information about the housing market in your area, please don’t hesitate to contact your Windermere Real Estate agent.

REGIONAL ECONOMIC OVERVIEW

Although the post COVID-19 job recovery took a step backward last winter, it has since picked up again, which is very pleasing to see. At the end of the second quarter, the state had recovered more than 276,000 of the 376,000+ jobs that were shed due to COVID-19. Even though employment levels are still almost 100,000 lower than the pre-pandemic peak, they are heading in the right direction. Looking at the markets contained in this report, current employment levels in Colorado Springs are only 2.2% below the pre-pandemic peak, followed by Denver and Fort Collins, which are both down 3.6% from the 2020 peak. I would add that all markets showed jobs continuing to return. With total employment levels rising, the unemployment rate stands at 6.2%, down from the pandemic peak of 12.1%. Regionally, unemployment levels range from a low of 4.8% in Boulder to a high of 6.3% in Grand Junction. COVID-19 infection rates dropped during the quarter, which is certain to lead to employment levels continuing to rise unless we see another significant increase in infection rates due to the rise of new variants across the country.

COLORADO HOME SALES

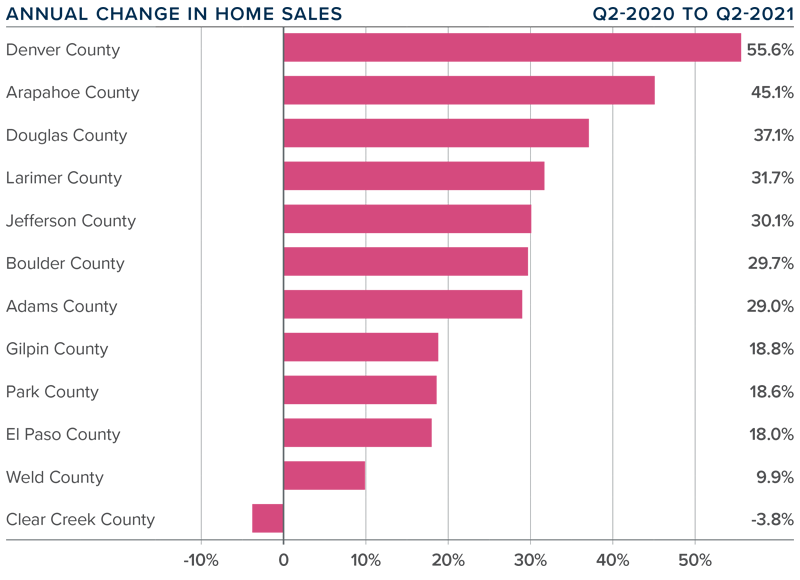
❱ The late spring/early summer market was a good one for home sales, which were up 33.9% from a year ago. Comparing the current quarter to a period when COVID-19 was widespread is not that informative, but, with sales up more than 55% from the first quarter of this year, the market appears to be very buoyant.

❱ Sales were higher in all counties other than the very small Clear Creek County. Where sales rose, they did so at double-digit rates in all markets other than Weld.

❱ During the second quarter, 13,428 homes sold. This is very impressive but not overly surprising, given that the average number of homes for sale was up 45% from the first quarter.

❱ Another positive was that pending sales, which are an indicator of future closings, were 42.8% higher than in the first quarter. This suggests that closings next quarter should be positive as well.

A bar graph showing the annual change in home sales for various counties in Colorado.

COLORADO HOME PRICES

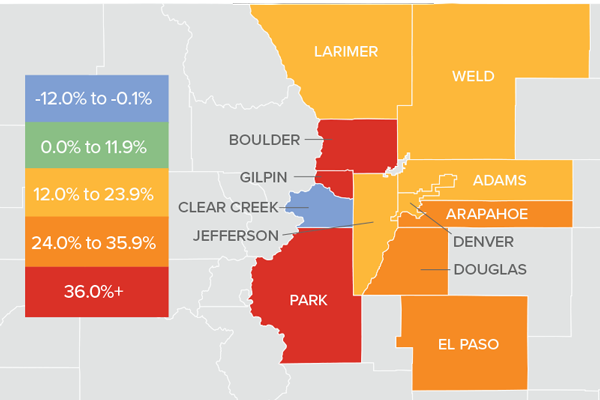
A map showing the real estate market percentage changes in various counties in Colorado.

❱ Prices continue to appreciate at an impressive pace, recording an increase of 28.1% year over year to an average of $615,409. Home prices were also 10.7% higher than the first quarter of this year.

❱ Buyer demand remains very strong, likely exacerbated by the drop in mortgage rates in the second quarter and improving levels of inventory.

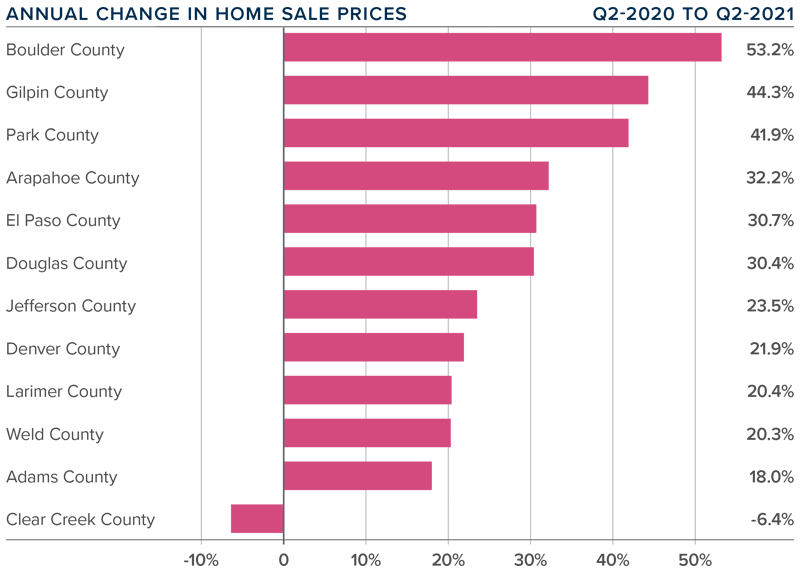
❱ Year-over-year, prices rose across all markets covered by this report, with the exception of Clear Creek County. Of the markets that saw prices rise, all did so by double digits, with very notable gains in Boulder, Gilpin, and Park counties.

❱ Affordability levels continue to trouble me, and the pace of price appreciation has to slow at some point. The market is clearly still out of balance, but as long as the credit quality of buyers remains high, I do not see any cause for concern.

A bar graph showing the annual change in home sale prices for various counties is Colorado.

DAYS ON MARKET

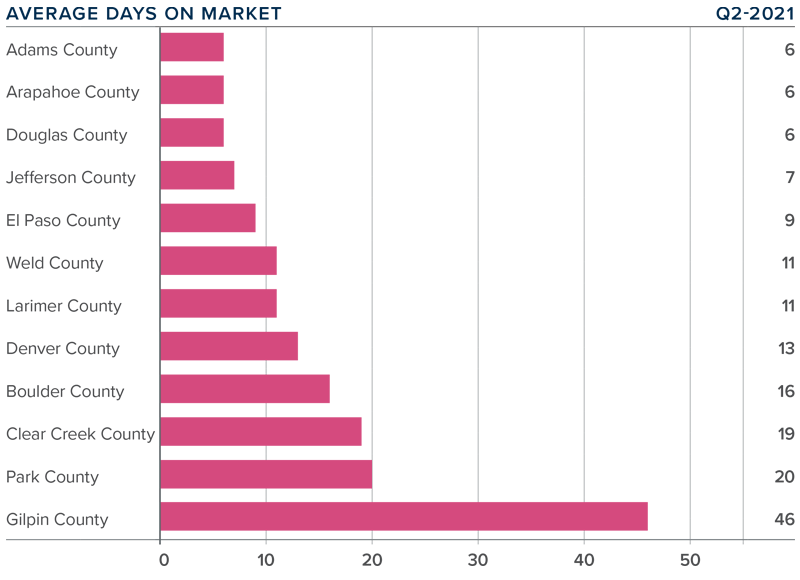
❱ The average number of days it took to sell a home in the markets contained in this report dropped 14 days compared to the second quarter of 2020.

❱ The amount of time it took to sell a home dropped in every county contained in this report compared to the second quarter of 2020. The exception was Gilpin County, where it rose by only two days.

❱ It took an average of only 14 days to sell a home in the region, which is down 11 days compared to the first quarter of this year.

❱ The Colorado housing market remains very tight, as demonstrated by the fact that it took less than a month for homes to sell in every county other than one.

A bar graph showing the average days on market for homes in various counties in Colorado.

CONCLUSIONS

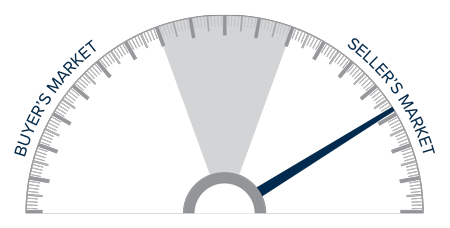
A speedometer graph indicating a seller's market in Colorado.

This speedometer reflects the state of the region’s real estate market using housing inventory, price gains, home sales, interest rates, and larger economic factors.

Sales rose on the back of lower mortgage rates and higher levels of homes available to buy. Although this should signify a move back to a more balanced market, we are not there yet as price growth remains well above the long-term average.

With solid demand and favorable financing rates, the market is expected to remain active as we move through the balance of the year. That said, housing affordability is becoming an increasingly large concern. According to the Colorado Association of REALTORS®, statewide affordability for single-family homes has dropped almost 20% year-over-year and is down 17.8% for multi-family homes.

At some point, an affordability ceiling will be reached, which will slow home-price appreciation—but not yet. As such, I am moving the needle a little more in favor of home sellers, as they remain in the driver’s seat, for now.

ABOUT MATTHEW GARDNER

Matthew Gardner - Chief Economist for Windermere Real Estate

As Chief Economist for Windermere Real Estate, Matthew Gardner is responsible for analyzing and interpreting economic data and its impact on the real estate market on both a local and national level. Matthew has over 30 years of professional experience both in the U.S. and U.K.

In addition to his day-to-day responsibilities, Matthew sits on the Washington State Governors Council of Economic Advisors; chairs the Board of Trustees at the Washington Center for Real Estate Research at the University of Washington; and is an Advisory Board Member at the Runstad Center for Real Estate Studies at the University of Washington where he also lectures in real estate economics.

BlogFort Collins Real EstateNOCO Real Estate August 3, 2021

Listing Averages

While a lot of attention has been paid to increasing sales prices along the Front Range, it is also interesting to look at the average price of properties currently listed for sale.

Did you know, for instance, that the average list price of all the properties currently for sale in Metro Denver is $887,000. Meanwhile, the average closed sales price is $613,000.

In Larimer County it is $793,000 versus an average closed sales price of $601,000.

In Weld County it is $669,000 versus $488,000.

What is causing this? The high number of high-end properties currently for sale pulling up the average.

You might be surprised to hear the number of $1,000,000-plus listings active listings in our market looks like this:

  • Metro Denver = 527
  • Larimer County = 75
  • Weld County = 44
Fort Collins Real EstateHousing MarketNOCO Real Estate July 6, 2021

Inventory Uptick

We are noticing a trend that is very good news for buyers.

Inventory has been increasing over the last month which means that buyers now have more properties to consider.

Just in the last week, the number of homes for sale has increased:

13% in Larimer County

12% in Weld County

11% in Metro Denver

If you are a buyer who has been waiting for home properties to look at, now is the time!

BlogFort Collins Real EstateVirtual Tour June 24, 2021

Sunrise Acres Ranch

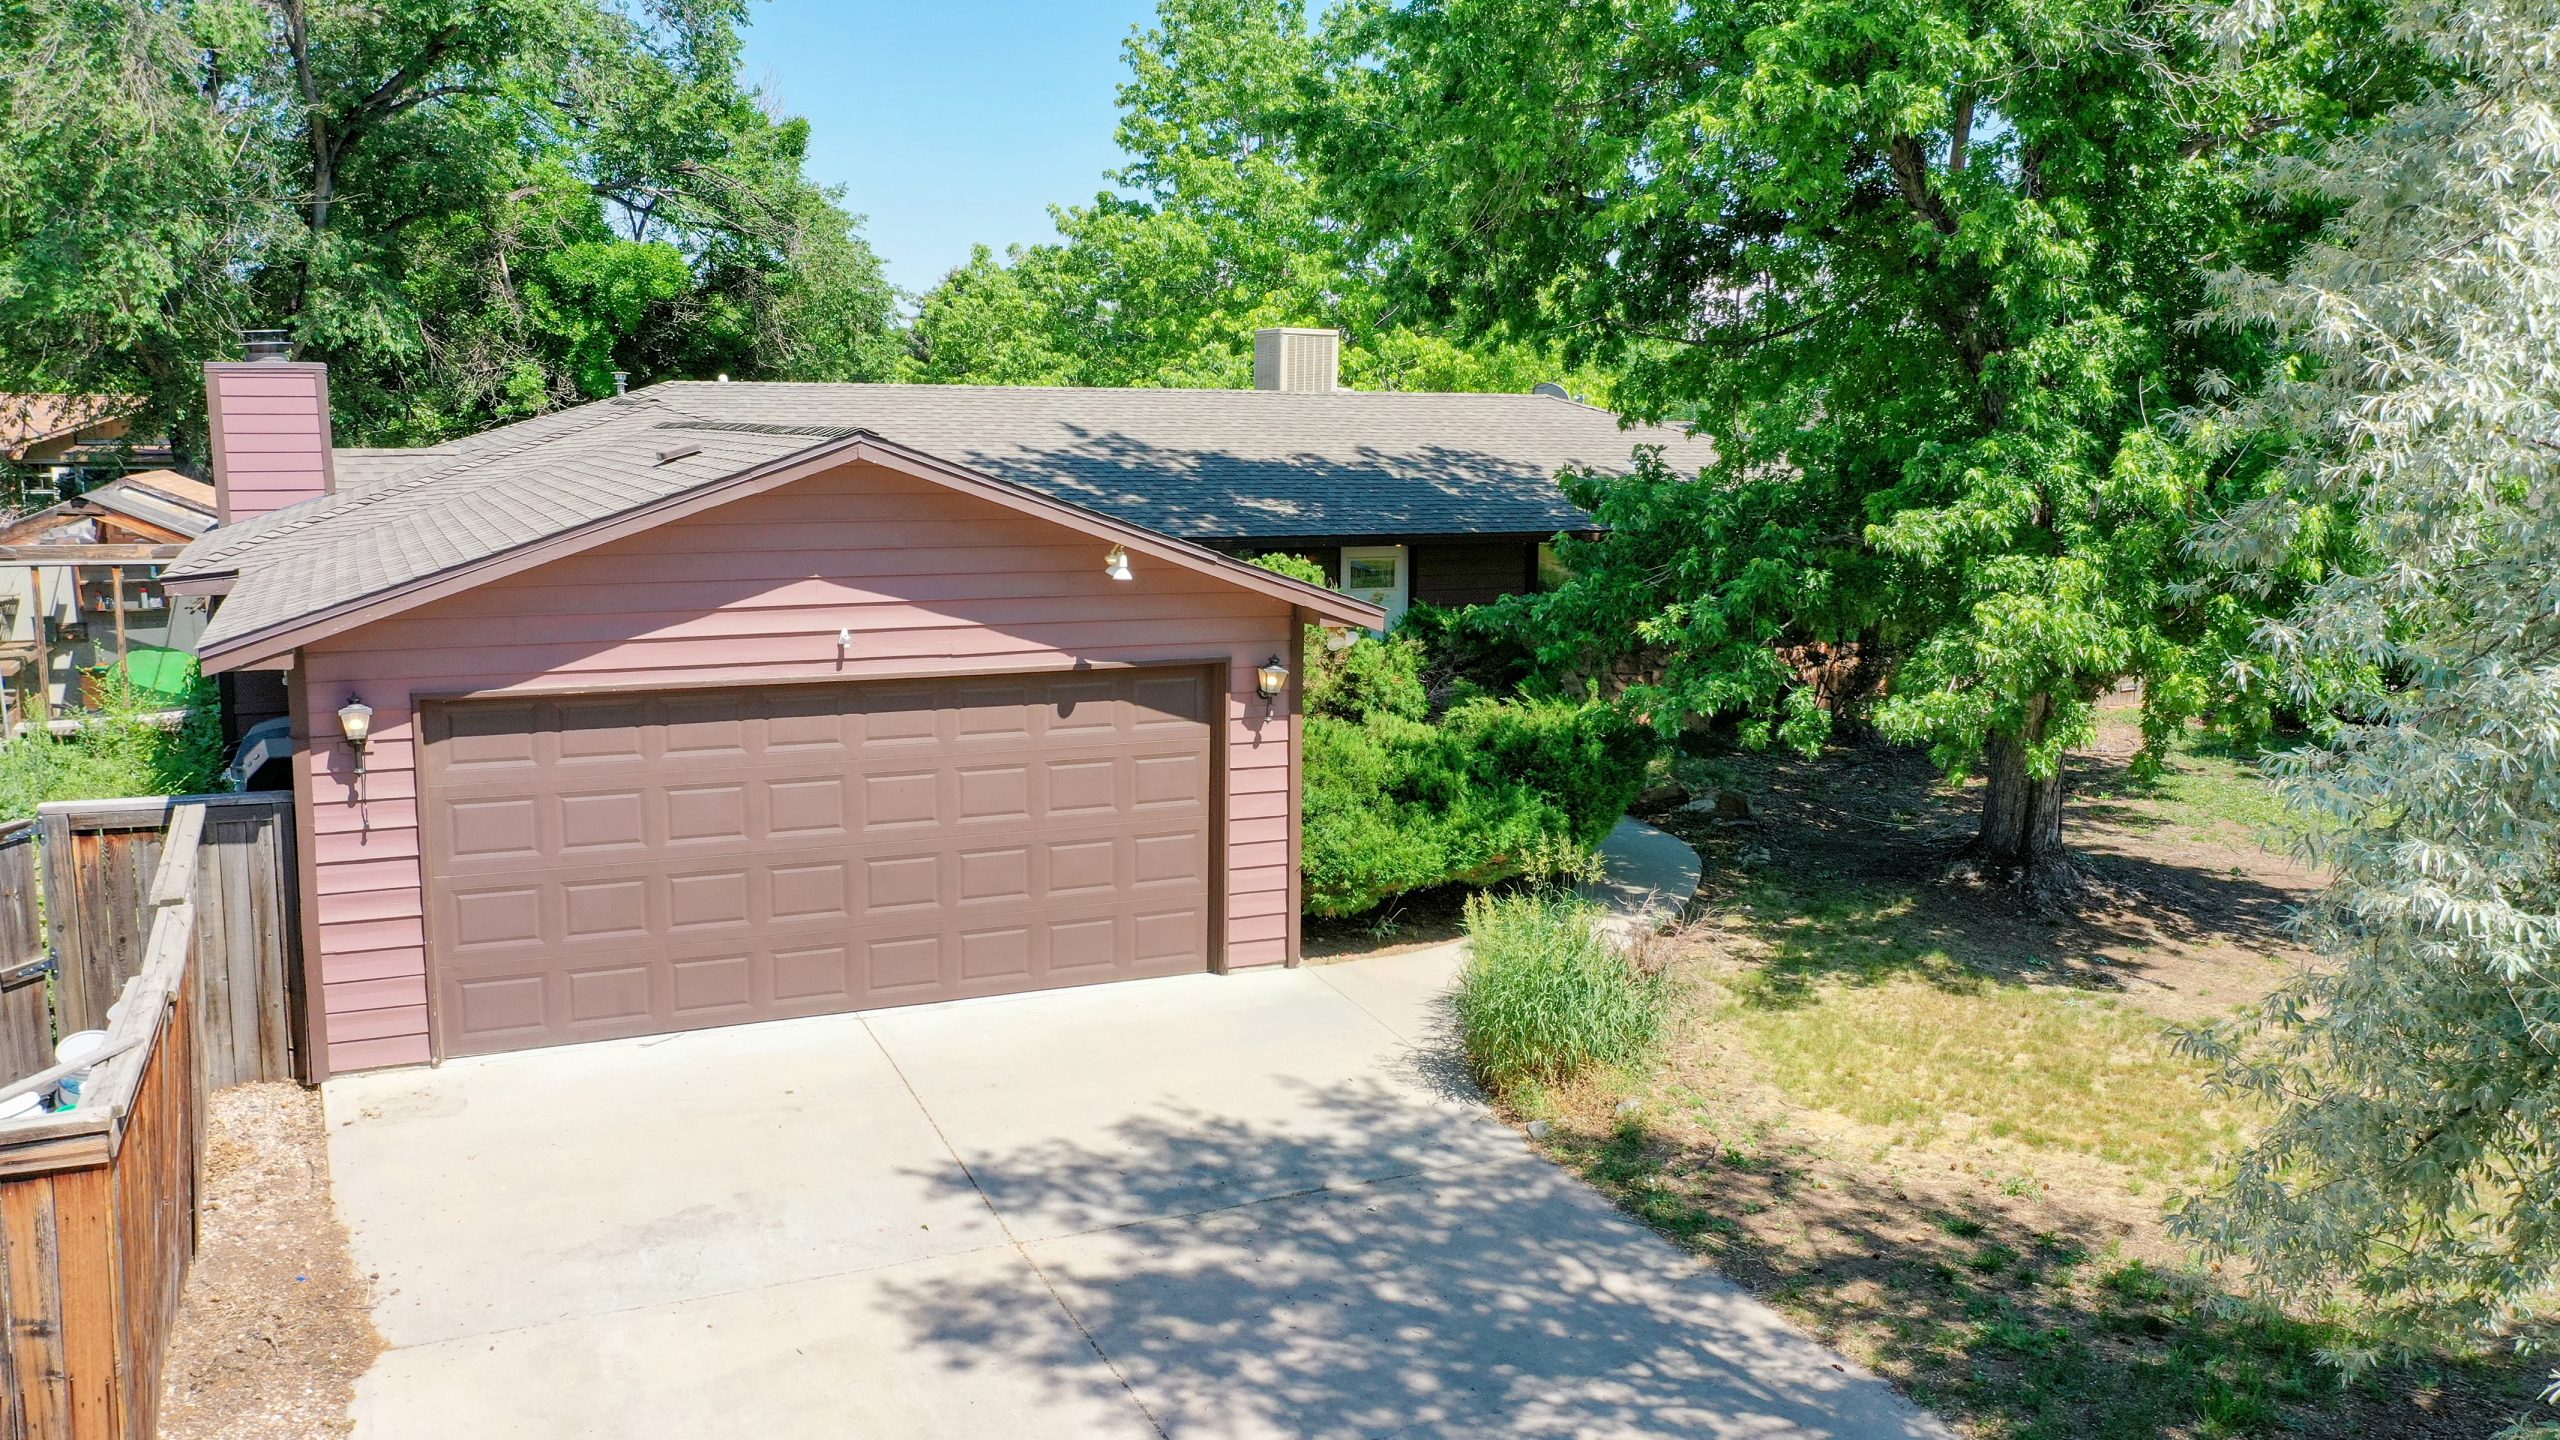
Settle into this rambling ranch located in Sunrise Acres in northeast Fort Collins. 800 Greenbriar Drive offers plenty of room to spread out- indoors and out – on nearly one third of an acre! Huge great room outfitted with fireplace. Tankless water heater and gorgeous custom 5-piece master bath with large custom walk-in wardrobe. Sliding doors to large private, fully fenced yard with mature landscaping and plenty of opportunities to add landscaping or garden beds. Shed with domestic well & attached greenhouse included. No HOA -space for RV, boat or toys! Home is just 3.6 miles from Old Town while maintaining has easy access to I-25 for commuters. Please note that a portion of the garage was remodeled into another bedroom room (permitted) so the garage is really an over-sized 1 car garage. Call (970) 534-5440 to schedule a private tour or click the link below for more details!

http://windermerenoco.com/listing/134861235